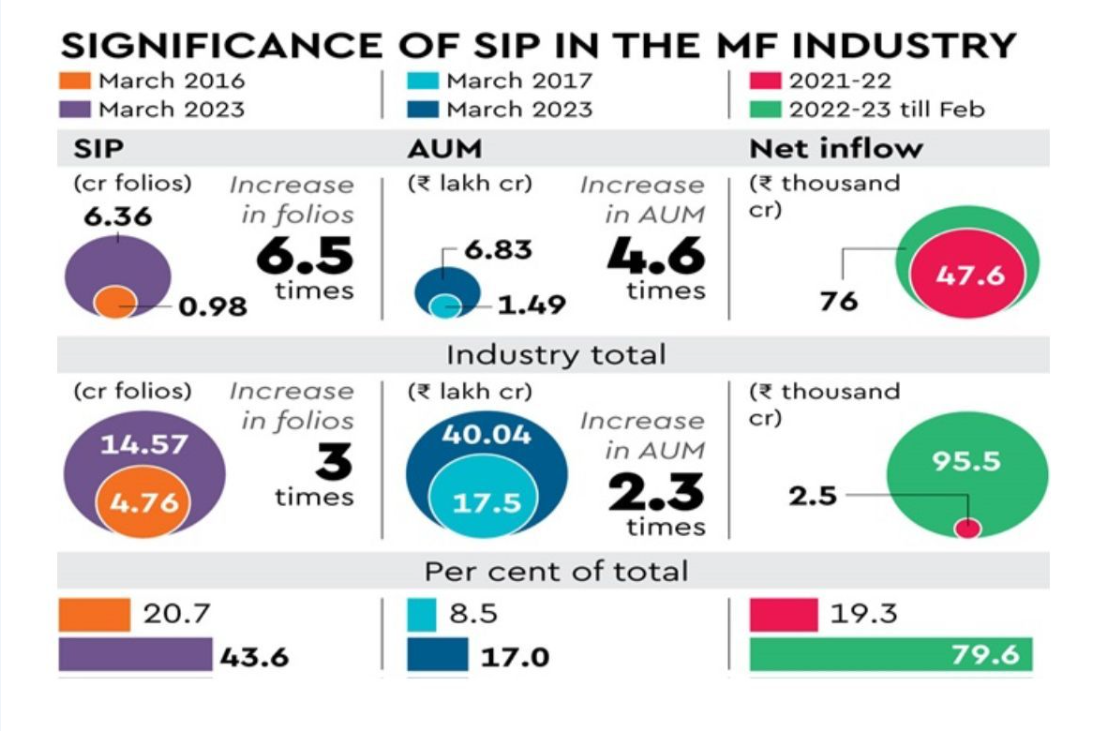
As seen in the last post the SIP monthly numbers are reaching new heights faster.
With the monthly numbers, it is also super important to look at the number of folios contributing. From 2016 to March 2023, there has been a 6.5 times increase in the folio count from 0.98 CR to 6.36 CR. The SIP AUM also increased from 1.49 Lakh CR to 6. 83 Lakh CR, which is a 4.6 times increase. Major contributor in reducing depending on FII’s.

To echo to what I have said above, the chart clearly depicts, from CY 13-22, the inflow contributions into the Indian Market by DIIs & FIIs are almost close, as you can see from the above bars. Fast forward it and compare it to CY 18-22 & CY 20-22, there has been a substantial increase in the inflow contribution by DIIs. 3.3x increase in the contribution by DIIs.
FII’s: Foreign Institutional Investors.
DII’s: Domestic Institutional Investors.
With the young population the digital adoption, and awareness of equity as an investment, things are looking bright for India. Once the interest rates cool down globally, which anyways are at fag end of the tightening, geo-political issues, and China opening up from covid, sooner or later the flows by FIIs will go up, which will lend huge support to the Indian Equity Markets.
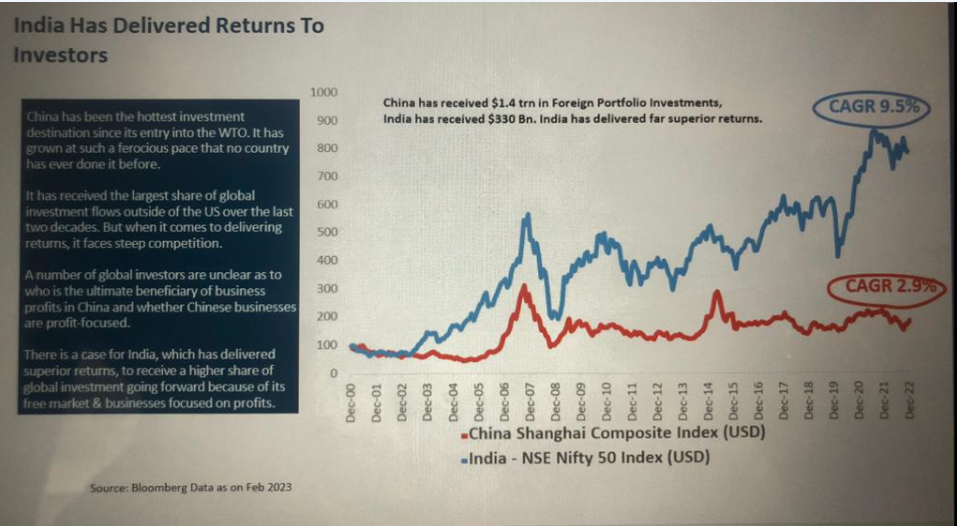
Even though India has received only $ 330 billion in the last 20 years to China’s $ 1.4 trillion.
Indian markets delivered, far superior returns than China, which can be seen from the graph.
India Delivered 9.5% ( USD) CAGR vs China’s 2.9% ( USD)
There is a case to be made for India, which has provided greater returns in the past. To get a larger part of FIIs money due to its free market and firms that are profit-driven.
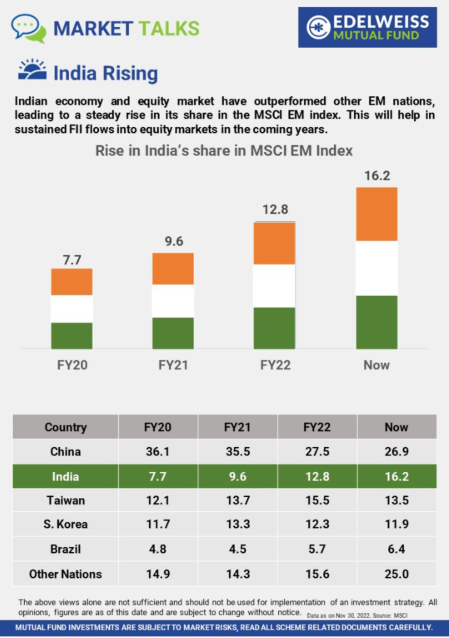
Some of the FII flows to India, typically come through MSCI EM ( Morgan Stanely Emerging Market Index). The above picture clearly shows that India’s share in the recent past has gone up.
India took the incremental share from China. India’s share in the MSCI EM in 2020 is 7.7% and now it is 16.2%. Close to a 120% increase.
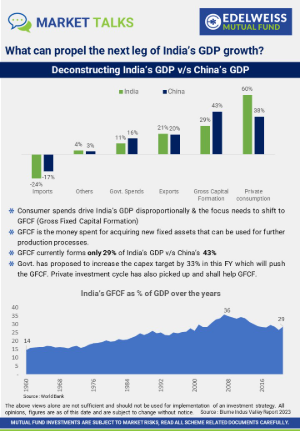
For any economy to grow consumer and government spending is vital.
The focus needs to shift to GFCF. Gross Fixed Capital Formation is the money spent on acquiring new fixed assets
GFCF currently forms only 29% of India’s GDP vs China’s 43%.

Sri Subhash Yerneni
Sri Subhash is an astute banking and finance professional with 14 years of real-world experience in wealth management, advisory of financial instruments such as mutual funds-equity and debt-alternate investment funds ( AIF)-structure and offshore products-private equity-venture capital/debt-bonds and MLDs-priority banking-cash management-team management-and working with various cultures in various nations.